//
//Correlation command
//
//This command makes correlation matrix.
//Syntax no option
corr [variables];
//
//Example is principal analysis using correlation of subjects.
//
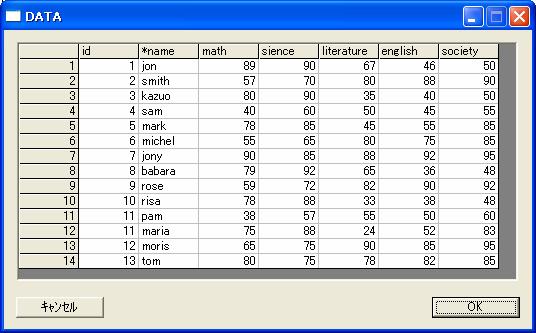
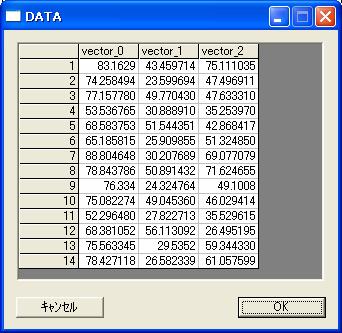
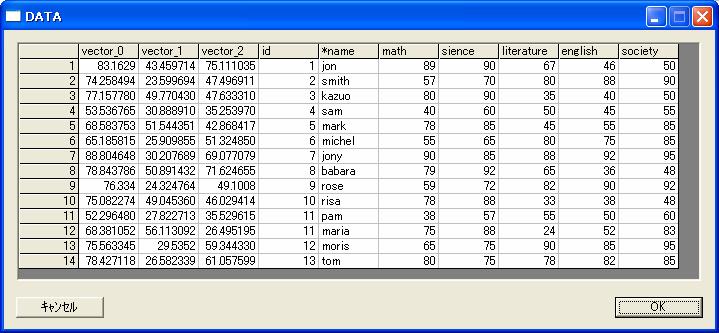
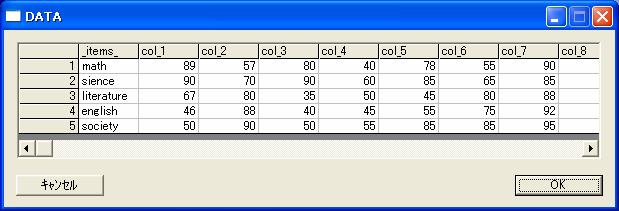
hand id name math sience literature english society/
1 jon 89 90 67 46 50
2 smith 57 70 80 88 90
3 kazuo 80 90 35 40 50
4 sam 40 60 50 45 55
5 mark 78 85 45 55 85
6 michel 55 65 80 75 85
7 jony 90 85 88 92 95
8 babara 79 92 65 36 48
9 rose 59 72 82 90 92
10 risa 78 88 33 38 48
11 pam 38 57 55 50 60
11 maria 75 88 24 52 83
12 moris 65 75 90 85 95
13 tom 80 75 78 82 85
;
put subject;

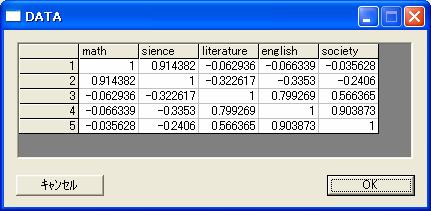
//Execute corration command for input of principal composition
corr math sience literature english society;

//plot corrateion within subjects.
plot math sience literature english society;
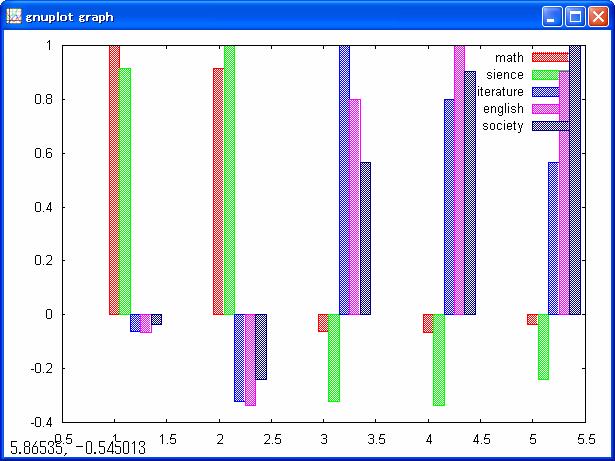
Liberal arts subjects inversely correlates with science subjects.
//Get output for principal composition
get freq@ana;
prin math sience literature english society/
input=corr
;
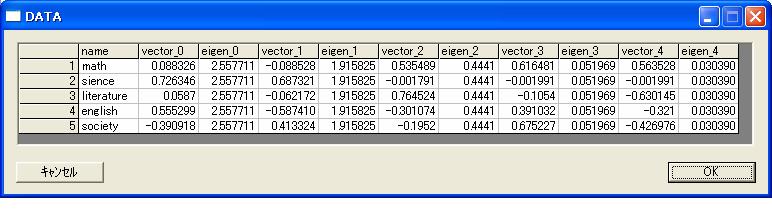
//Get output of prin command.
get freq@ana;
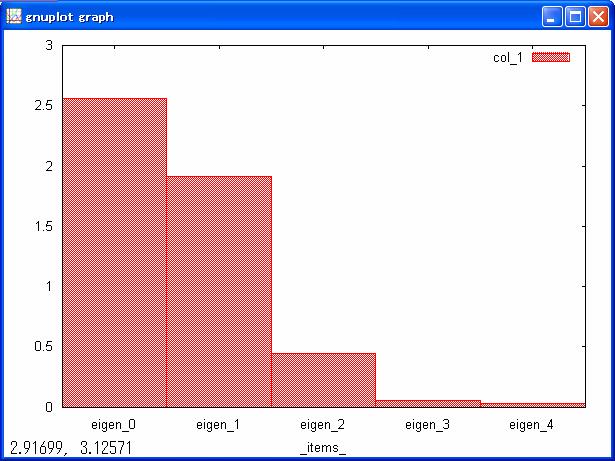
//Inspection eigen value;
if(# == 1) {
outrec;
}
plot bar eigen0-4;
First and second eigen value is too larager than else.
//Get output of prin command again.
select vector_0 - 1;
put prin;
//Get subject points and calcurate score which is multed points and eigen vectors by mxmult command.
get subject;
mxmult math sience literature english society by prin;
//merge score to score list to add member name.
merge subject by #;
//Plot score of each member by 3D of principal vector.
plot scat vector_0 -1 by name;
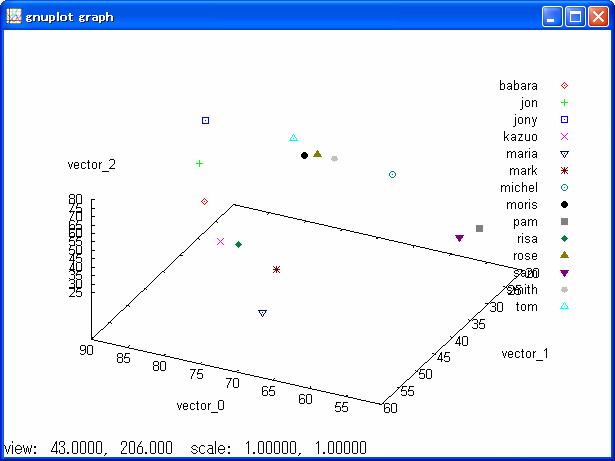
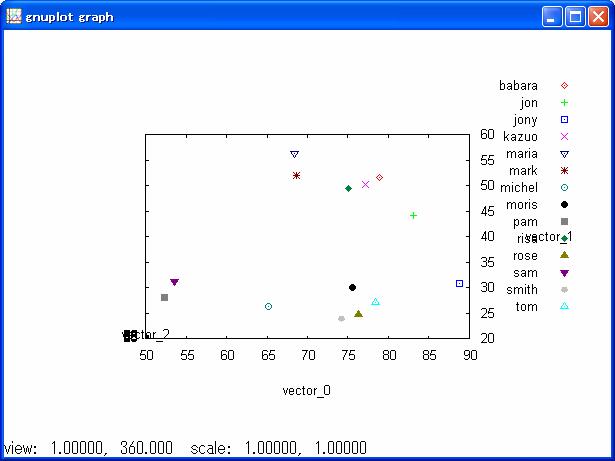
vector_0 score may be science subject
vector_1 score may be variance within subjects
//
//Inspection variance of subjects.
//
//transpose subject and points data to calcurate variance of each member.
get subjects;
transpose math sience literature english society;
//Get average and variance of points of each member
statis col_1-14;
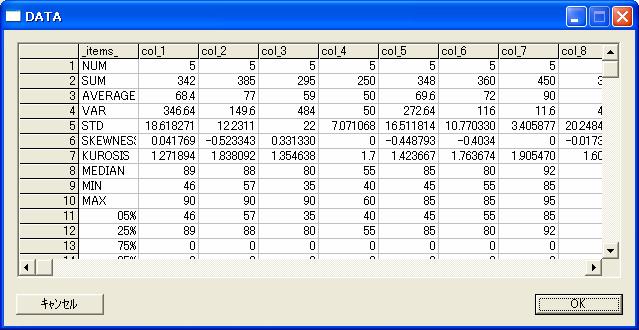
//Select avarage and variance only;
get freq@ana;
transpose;
select AVERAGE STD;
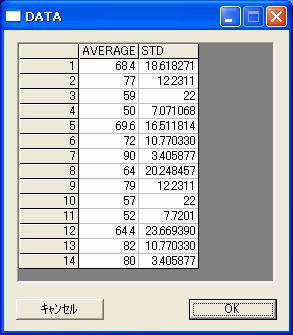
//Add name to average and variance list
merge subject by #;
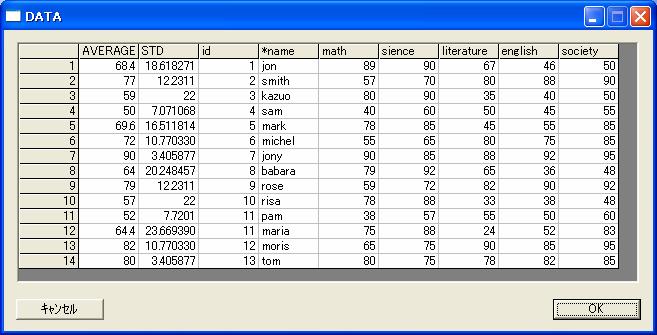
//Sort acending standard deviation.
sort STD;
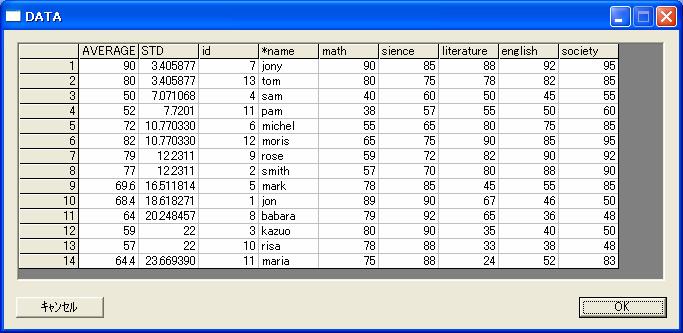
member which have fewer std are above position in vector_0 and vector_1 of scat plot.
//
//Inspection variance of subjects.
//
get subject;
//Sum of science subject points and sort descending sum points.
sceientific=math+sience;
sort - seientific;
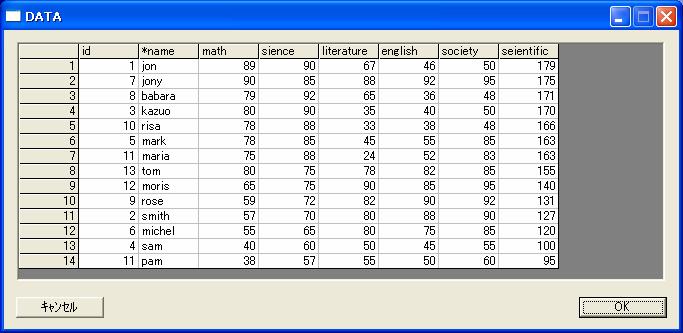
member which have higher sceientific value are right position in vector_0 and vector_1 scat plot.